Scroll below for examples of Archived Commentary
from 2011 and the first half of 2012
AS OF TUESDAY morning, 16 AUG 11
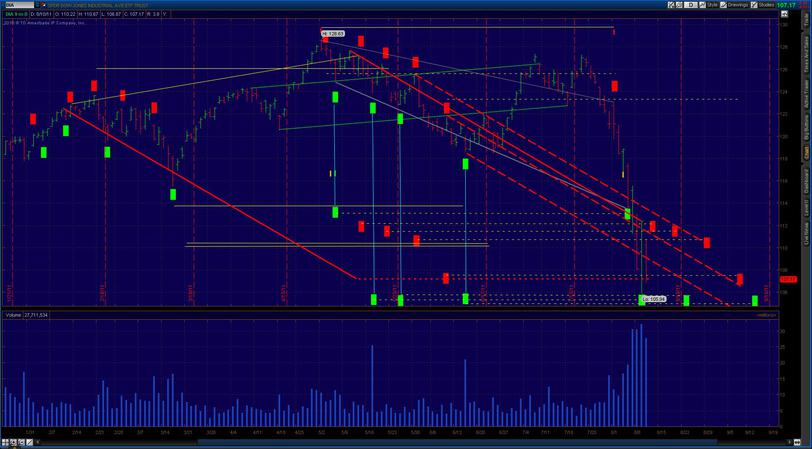
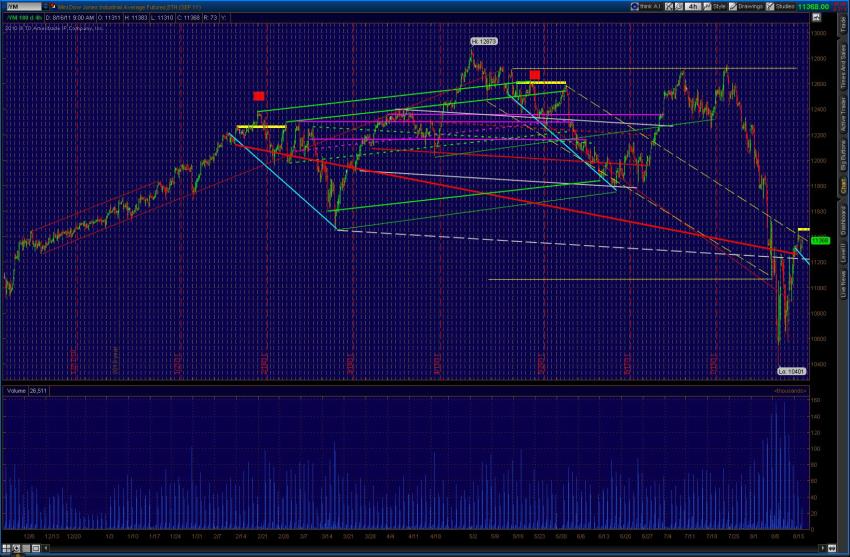
The major market in high cap stocks has continued its recent price stabilization, and is presently holding up. However, it is already trading trading in the Upper 2ND Level Forecast Recovery Price Range Area. The ProtectVEST/AdvanceVEST 'look' (or 'focus') is for QEV and 2QEV EBD signal weakness to occur this week, likely in the second half, and coming, more precisely, around option expiration.
SEE EASYGUIDECHARTS BUTTON
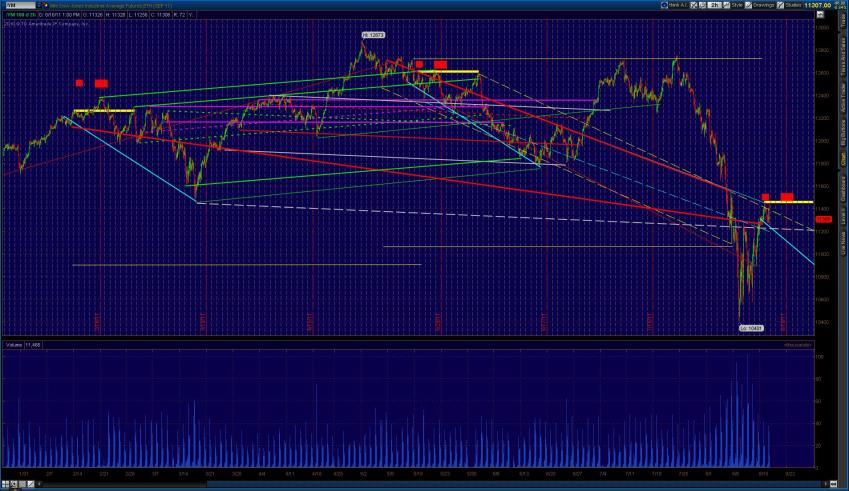
The two forward and highlighted and now ensuing periods beginning with Red-block (and each lasting about a week) present the most significant challenge to the price recovery off recent lows earlier in the month. These red signal blocks could, in part, contribute to the generation of an ACTIONABLE ALERT issued within the MDPP Forecast and Alert Model.
An additionally forecasted move in ST price re-strengthening in gold came in yesterday.
EasyGuideChart: DIA Equivalency Basis. We have entered the QEV 2QEV ETD caution area, highlighted by the yellow horizontal bars.
Sample EchoVectorVEST MDPP Traders' Edge EasyGuideChart
Vintage Archive Year 2011
Used For Illustrating ProtectVEST and AdvanceVEST by EchoVectorVEST MDPP
Tutorial EasyGuideChart Market Forecast Projection Scenario Setup Opportunities
And Tutorial Focus Interest Opportunity Periods And Signals
KEY Model-Generated Focus Interest Opportunity Period (FIOP)
EchoBackPeriods Key EchoBackPeriod TPPs EchoBackPeriodDirectionalBiasBlocks & Block Extensions
EchoBackPeriod FIOP I/O Blocks
Blocks and Boxes
With Model-Generated Forward Forecast Projection FIOP EchoTradeDates and EchoTimePoints Included
AS OF 12:30PM EST TUESDAY 16 August 11
ALERT: Caution ALERT: DEV PRECISION PIVOT
At 12:29PM EST TODAY MDPP issued a DEV MDPP PRECISION PIVOT ALERT indicating a significant potential trend reversal challenge to the recovery uptrend is from the earlier AUGUST lows is now in EFFECT. LONG Position covering at 114.25 to 115 on the DIA equivalency basis from the 106 lows earlier in August is now recommendable. This pivot was also preceeded by the obtainment of a KEY MDPP QEV price level attainment and fulfilment.
ProtectVEST by EchoVectorVEST
"We're keeping watch AND watching out for you."
ProtectVest and AdvanceVest by EchoVectorVest, Divisions of Motion Dynamics and Precision Pivots, Bradford Market Research and Analytics
Currently A FREE Educational, Forecast Opinion, and Forecast Methodology and Related Strategies Discussion Resource and Forum
EDUCATIONAL AND TUTORIAL
FINANCIAL MARKETS INTELLIGENCE
BLOGS, ARTICLES, PUBLICATIONS, POSTS,
PODCASTS, BROADCASTS, INTERACTIVE SESSIONS
INFORMATION ALERTS AND COMMENTARY
FORECAST PROJECTIONS, ANALYSIS, AND STRATEGIES
THE MARKET PIVOTS FORECASTER
AND ACTIVE ADVANCED POSITION AND RISK MANAGEMENT NEWSLETTER
THE MARKET ALPHA NEWSLETTERS GROUP'S
FREE ONLINE CONSOLIDATED FINANCIAL NEWSLETTERS VERSION,
INCLUDING MARKETINVESTORSWEEKLY.COM
BY BRIGHTHOUSEPUBLISHING.COM
SEEKINGALPHA ECHOVECTOR ANALYSIS
STOCKTWIT(TER) - STOCKTWITS ECHOVECTOR ANALYSIS
BENZINGA ECHOVECTOR ANALYSIS
PINTEREST ECHOVECTOR ANALYSIS
TWITTER ECHOVECTOR ANALYSIS
MARKETPIVOTSTV ECHOVECTOR ANALYSIS
SP500TV ECHOVECTOR ANALYSIS
OPTIONPIVOTSLIVE ECHOVECTOR ANALYSIS
Apr 29, 2012 6:52 PM | : DIA, SPY
Some Analysts are asking why the Federal Reserve choose to talk up the economy this past week, and subsequently the markets, at such a critical technical price level time and juncture, this past week, the end of April?They are wondering if the Fed-projected good news is as reliable as some analysts might hope.
Other more Fed-confident analysts are also electing to remind us that, regardless of present concerns of market price levels perhaps showing fatigue recently, we might want to remember that old Wall Street Mantra:"Don't Fight the Fed!"
Yet, along with the age-old mantra, and coming into particularly timely relevance next week, is another old and often reliable Wall Street Mantra: "Sell in May and Go Away!"
A key question for investors this year is, which of these mantra's will win out this 2012 market year? And analysts want to have been found on the right side of the answer, especially going forward this Presidential Election year?
We believe Federal Reserve's current loose monetary policy makes it undesirous of seeing any a precipitous conclusion to current upward price momentum in equities and subsequently generated wealth effect.
The present historical weights of the Presidential Cycle and Annual Cycle, going forward into this coming week and month of May, 2012, counter the Fed's objectives. So talking up the market this last week, at this key and critical technical juncture and composite market price level ensued.
However, the question remains. Will talk be sufficient to prevent the powerful market forces of these price cycles and echovectors from fulfilling themselves, especially with all geopolitical, macroeconomics, and domestic employment uncertainties currently being considered by the market?
We believe the market itself will tell us the answer to this question very soon.
However, I also maintain, on a historical price basis, that (in the meantime) wisdom may reside in applying and holding full net portfolio composite price level insurances (hedges and hedging applications) going forward into May this year.
Such a strategy may be particularly timely on a risk-to-reward basis for this next quarter, and beyond...
Below is a Five-Year, Weekly, OHLC, Chart of the DJX, the 1/100TH Index of the Dow Jones 30 Industrial Average.
This chart highlights the key Presidential Cycle echovectors, and 4-year echobackdates in 2008 for the current 2012 market year.
It also includes some key annual echoVectors, and 1-year echobackdates in 2011 for the present 2012 market year (currently in force as a result of 'follow through' to key 2010 echovectors and 1-year echobackdates to the 2011 market year).
The chart is very time-cycle revealing, and price-support level and price-resistance level revealing, and longer-term price support pivoting-vector revealing.
Highlighted in pink, notice the current Presidential Cycle echovectors and the Presidential Cycle echobackdate period we are currently entering.
Highlighted in aqua-blue, notice the current key annual cycle echovector and Annual cycle echobackdates, and last years springtime upward momentum finish we are currently entering.
Also, highlighted in horizontal solid green, notice the price equivalency basis recovery level we have now achieved on this months Presidential Cycle echovector.
Highlighted in red and green spaced-lines are various key Presidential Cycle echovectors and Presidential cycle echobackdates that came into play in last year's spring and summer price level swoon.
Their co-ordination is quite remarkable, especially regarding various near-term relative strength and relative weakness time-points.
Might this analysis and view indicate near-term price level caution?
DJX: (1/100TH of the Dow Jones 30 Industrial Average)
5-Year Weekly OHLC
Key Presidential Cycle EchoVectors and EchoBackDates
Key Annual EchoVectors for 2012 and 2011.
Key 1-Year EchoBackDates for 2012 and 2011
Click on chart at above link, then click on chart there to enlarge, and then right click on chart there to open in new tab, then click on chart in new tab
to be able to further zoom
ProtectVEST and AdvanceVEST By EchoVectorVEST
"We're keeping watch for you!"
Themes: SPY, SPX, QQQ, OEX, XMI, MMI, IWM, ETF, Major Market Large Cap Composite Indexes, Stock Market Outlook, Market Analysis, Technical Analysis, Cyclical Analysis, Price Analysis Stocks: DIA, SPY, QQQ, IWM
May 4, 2012 | includes: SPY, DIA
Don't Fight The Fed
on Wed, Aug 1 • DIA, SPY •
Chart: The S&P And 'Should I Still Stay Away If I Sold In May?'
on Fri, Jul 13 • SPY, DIA •
Shorting Or Longing The Current 9 Percent Market Correction?
on Mon, May 21 • SPY, DIA •
The S&P: Is More Correction Coming?
on Mon, May 21 • SPY, DIA •
Powerful Results Last Week: Forecasting And Utilizing Key Broad Market Futures Daily Price Symmetries
on Mon, May 21 • CSCO, SPY, DIA •
May's Stock Market Volatility
on Fri, May 11 • DIA, SPY •
Chart: The XMI And Incredible Price Path Coordination In 2011 And 2012
on Tue, May 8 • XMI, DIA, SPY •
Last Week's Market Reversal And Present Straddle Opportunity
on Mon, May 7 • SPY, DIA •
Chart: The S&P And 'Sell In May' In An Election Year
on Fri, May 4 • SPY, DIA •
ProtectVEST and AdvanceVEST By EchoVectorVEST MDPP PRECISION PIVOTS
"Positioning for change, staying ahead of the curve, we're keeping watch for you!"
CURRENT FREE ONLINE FORECAST MODEL-BASED
EDUCATIONAL AND TUTORIAL MARKET INTELLIGENCE
INFORMATION PORTALS
(CONSOLIDATED SHORT LIST)
PROTECTVEST AND ADVANCEVEST BY ECHOVECTORVEST MDPP PRECISION PIVOTS
PROTECTVEST AND ADVANCEVEST BY ECHOVECTORVEST MDPP PRECISION PIVOTS
DISCLAIMER
This post is for information purposes only.
There are risks involved with investing including loss of principal. PROTECTVEST AND ADVANCEVEST BY ECHOVECTORVEST MDPP PRECISION PIVOTS and its Divisions and Subdivisions makes no explicit or implicit guarantee with respect to performance or the outcome of any investment or projections presented or discussed by PROTECTVEST AND ADVANCEVEST BY ECHOVECTORVEST MDPP PRECISION PIVOTS and its Divisions and Subdivisions.
There is no guarantee that the goals of the strategies discussed by PROTECTVEST AND ADVANCEVEST BY ECHOVECTORVEST MDPP PRECISION PIVOTS and its Divisions and Subdivisions will be achieved.
NO content published by us on the Site, our Blog, and any Social Media we engage in constitutes a recommendation that any particular investment strategy, security, portfolio of securities, or transaction is suitable for any specific person. Further understand that none of our bloggers, information providers, App providers, or their affiliates are advising you personally concerning the nature, potential, value or suitability of any particular security, portfolio of securities, transaction, investment strategy or other matter.
Again, this post is for information purposes only.
Before making any investment decisions we recommend you first consult with you personal financial advisor.
Copyright 2011-2022. PROTECTVEST AND ADVANCEVEST BY ECHOVECTORVEST MDPP PRECISION PIVOTS. All Rights Reserved.
ProtectVEST and AdvanceVEST by EchoVectorVEST MDPP
Samples from Archived Commentary


